Ortelius Blog
Topics include Supply Chain Security, Vulnerability Management, Neat Tricks, and Contributor insights.
Microservice Monitoring and Visualization
Microservices Monitoring and Visualization
Microservices have opened new doors in the field of software engineering. The process of monitoring the application has evolved as well, involving multiple services with multiple running instances. Monitoring is essential in order to understand the multi-layered architecture and to identify bottlenecks to optimize performance.
Observability is not just necessary to investigate the error incidents, but also helpful in making day-to-day operations such as deployments of new features, optimizing code and planning architectural changes, easier to implement.
Change is the only thing constant. Whether it is planned change like a deployment of new features or unplanned change like system downtime, change happens. Each change can impact multiple services. The purpose of observability is to link the causes with the changes in service, infrastructure and critical business parameters. It is important to note, that monitoring and observability is reactive, showing what is occurring on a specific cluster at a specific time. This is what is referred to as telemetry data.
Telemetry Data
There are three major types of data that make systems observable : logs, metrics and traces.
Logs : They are structured or unstructured lines of text that are produced by an application in response to some event in the code. They are distinct records of the event that took place in the system at a specific time.
127.0.0.1 - frank [10/Oct/2000:13:55:36 -0700]
"GET/apache_pb.gif HTTP/1.0" 200 2326
Metrics : A metric represents some data related to a system.Metrics are usually represented as counts or measures, like memory required by a service, total number of requests handled by a service, etc.
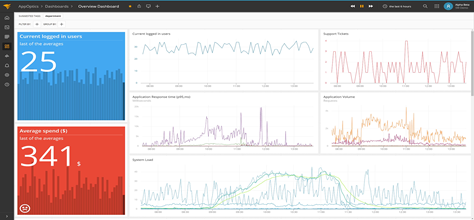
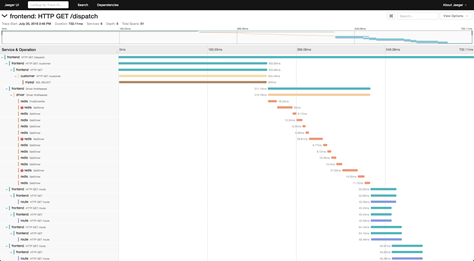
Traces : A single trace shows the activity for an individual transaction or request as it flows through the various services of an application.
Evolution of Monitoring
Single Service, Single Instance - In the case of a single service with only a single instance running, it’s easier to monitor the service. The logs and metrics are easier to interpret and helpful in the case of debugging the system errors.
Single Service, Multiple Instances - To make the application scalable, multiple running instances are required. It’s essential to get the logs and metrics data for each instance and also the collective data for all the instances. The metrics data is aggregated from all the instances with individual metrics also available. Logs are much easier to understand when collected together rather than checking for each instance. Multiple Services, Multiple Instances - Things get interesting when multiple instances have different services and versions of services running. The answer to this scenario is also aggregation of data. One service might invoke multiple downstream services during a transaction. Transaction traces are required to observe the flow through the involved services. Unique IDs are assigned to each transaction called correlation IDs which are passed to the downstream services. Correlation IDs can be printed in the logs and with log aggregation, the logs can be easily interpreted for the error transactions.Unification of Telemetry Data
Traditionally, the tools for telemetry data : logs, tracing and metrics have been split. Each tool has its own separate technique with separate communities and separate tool chains. The entire data collection and analysis pipeline for each tool has nothing in common.
Removing this separation and creating a single stream of data, which shares context and correlation among the observations, creates a more insightful tool. For example, if logs are collected as traces, and traces are associated with metrics, then alerts can automatically collect examples of problem operations when they are triggered.
Many organizations are moving in a fundamentally different direction: away from having these specialized tools for different types of metrics and towards more generic event routing systems capable of significant scale. These systems provide much more flexibility, while at the same time actually simplifying our architecture. They have enhanced the detection time for root causes and helped getting metrics for business KPIs.
OpenTelemetry
To implement all of the desired unification changes, the industry came together to define a shared standard for observability : OpenTelemetry.
“OpenTelemetry is a set of APIs, SDKs, tooling and integrations that are designed for the creation and management of telemetry data such as traces, metrics, and logs. The project provides a vendor-agnostic implementation that can be configured to send telemetry data to the backend(s) of your choice. It supports a variety of popular open-source projects including Jaeger and Prometheus.”
Ortelius and Proactive Visualization Maps
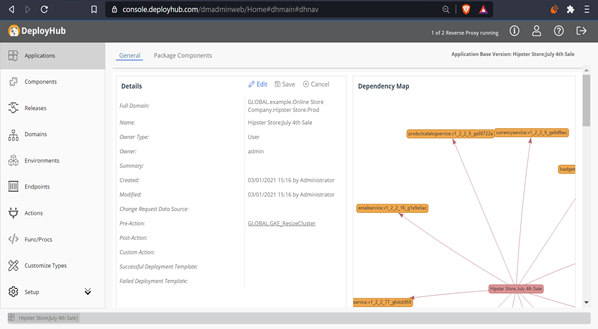
The Ortelius open source project aims to enhance observability by creating proactive visualizations of service relationships and consuming application dependencies across all clusters - even before a service is deployed. This level of visualization simplifies the move to microservices by removing the guess work, i.e., the ‘blast radius’ of a single service on all clusters.
Ortelius integrates with deployment engines to release microservices (and other Components) tracking their current state and history across multiple environments (Kubernetes, cloud, virtual). Ortelius also integrates with your CI/CD pipeline to automate this level of microservice configuration management making the process of building the visualization maps easy.
Ortelius focuses on providing your application teams a ‘logical view’ of their application’s versions and ‘package’ with SBOMs and Difference Reports. It provides a central ‘hub’ for cataloging, versioning, sharing and tracking the inventory of services across clusters.
Ortelius Visualization Data
Ortelius uses container data, deployment logs and its own revision history and relational model to present the maps:
Container SHA - Using the container SHA, Ortelius creates a unique ID for each new version of a microservice. Each new version of a microservice creates a new version of every application that consumes the microservice.
Application Baseline Package and Change SBOM - Each application version includes a bill of material showing all versions of the microservices that it consumes. A new version of a microservice creates a new version of the consuming application and a new SBOM.
Revision History and Difference Maps- Each Environment, Application and service includes a history log that is used to compare differences between application versions, microservice versions and the state of an Environment.
Deployment Logs - To track cluster inventory, the deployment of each microservice is recorded, allowing Ortelius to track an Environment state at any point in time.
Conclusion
As you move into a microservice architecture, you will need the ability to first ‘visualize’ your microservice configuration data across clusters, with the proactive knowledge of how a single change will impact multiple instances. Once deployed, your telemetry data will provide you cluster observability which is critical in improving performance. Knowing before you deploy and then understanding what occurred after deployment provides the complete picture for building out a solid microservice architecture.
Outro
Hope this blog helped you in getting started in your journey of monitoring your microservices. Looking forward to connecting with you and sharing our knowledge.
Karamjot Singh is a Microservice Developer and Cloud Architect. He is a core member of the Ortelius Architecture Working Group. You can reach him on LinkedIn.